In the field of professional services procurement, selecting and tracking the right performance indicators (KPIs) is essential for optimizing both costs and quality. During the HA!DAYS in June 2024, nearly 80 procurement decision-makers highlighted the importance of improving performance management, stressing the need for solutions tailored to KPI tracking and analysis. In this context, we offer guidance on how to define your KPIs and manage your spending effectively, along with the various performance criteria for your procurement processes and service suppliers.
Professional services procurement: necessary KPIs but challenging to define
In the context of professional services procurement, it is important to select specific KPIs, particularly considering challenges such as the shortage of experts in key areas. The quality of these services depends on intangible skills such as soft skills and experience, which can make evaluation complex.
How to choose KPIs to effectively manage professional services procurement ?
To choose your KPIs effectively, start by aligning your indicators with the main objectives of your professional services procurement strategy.
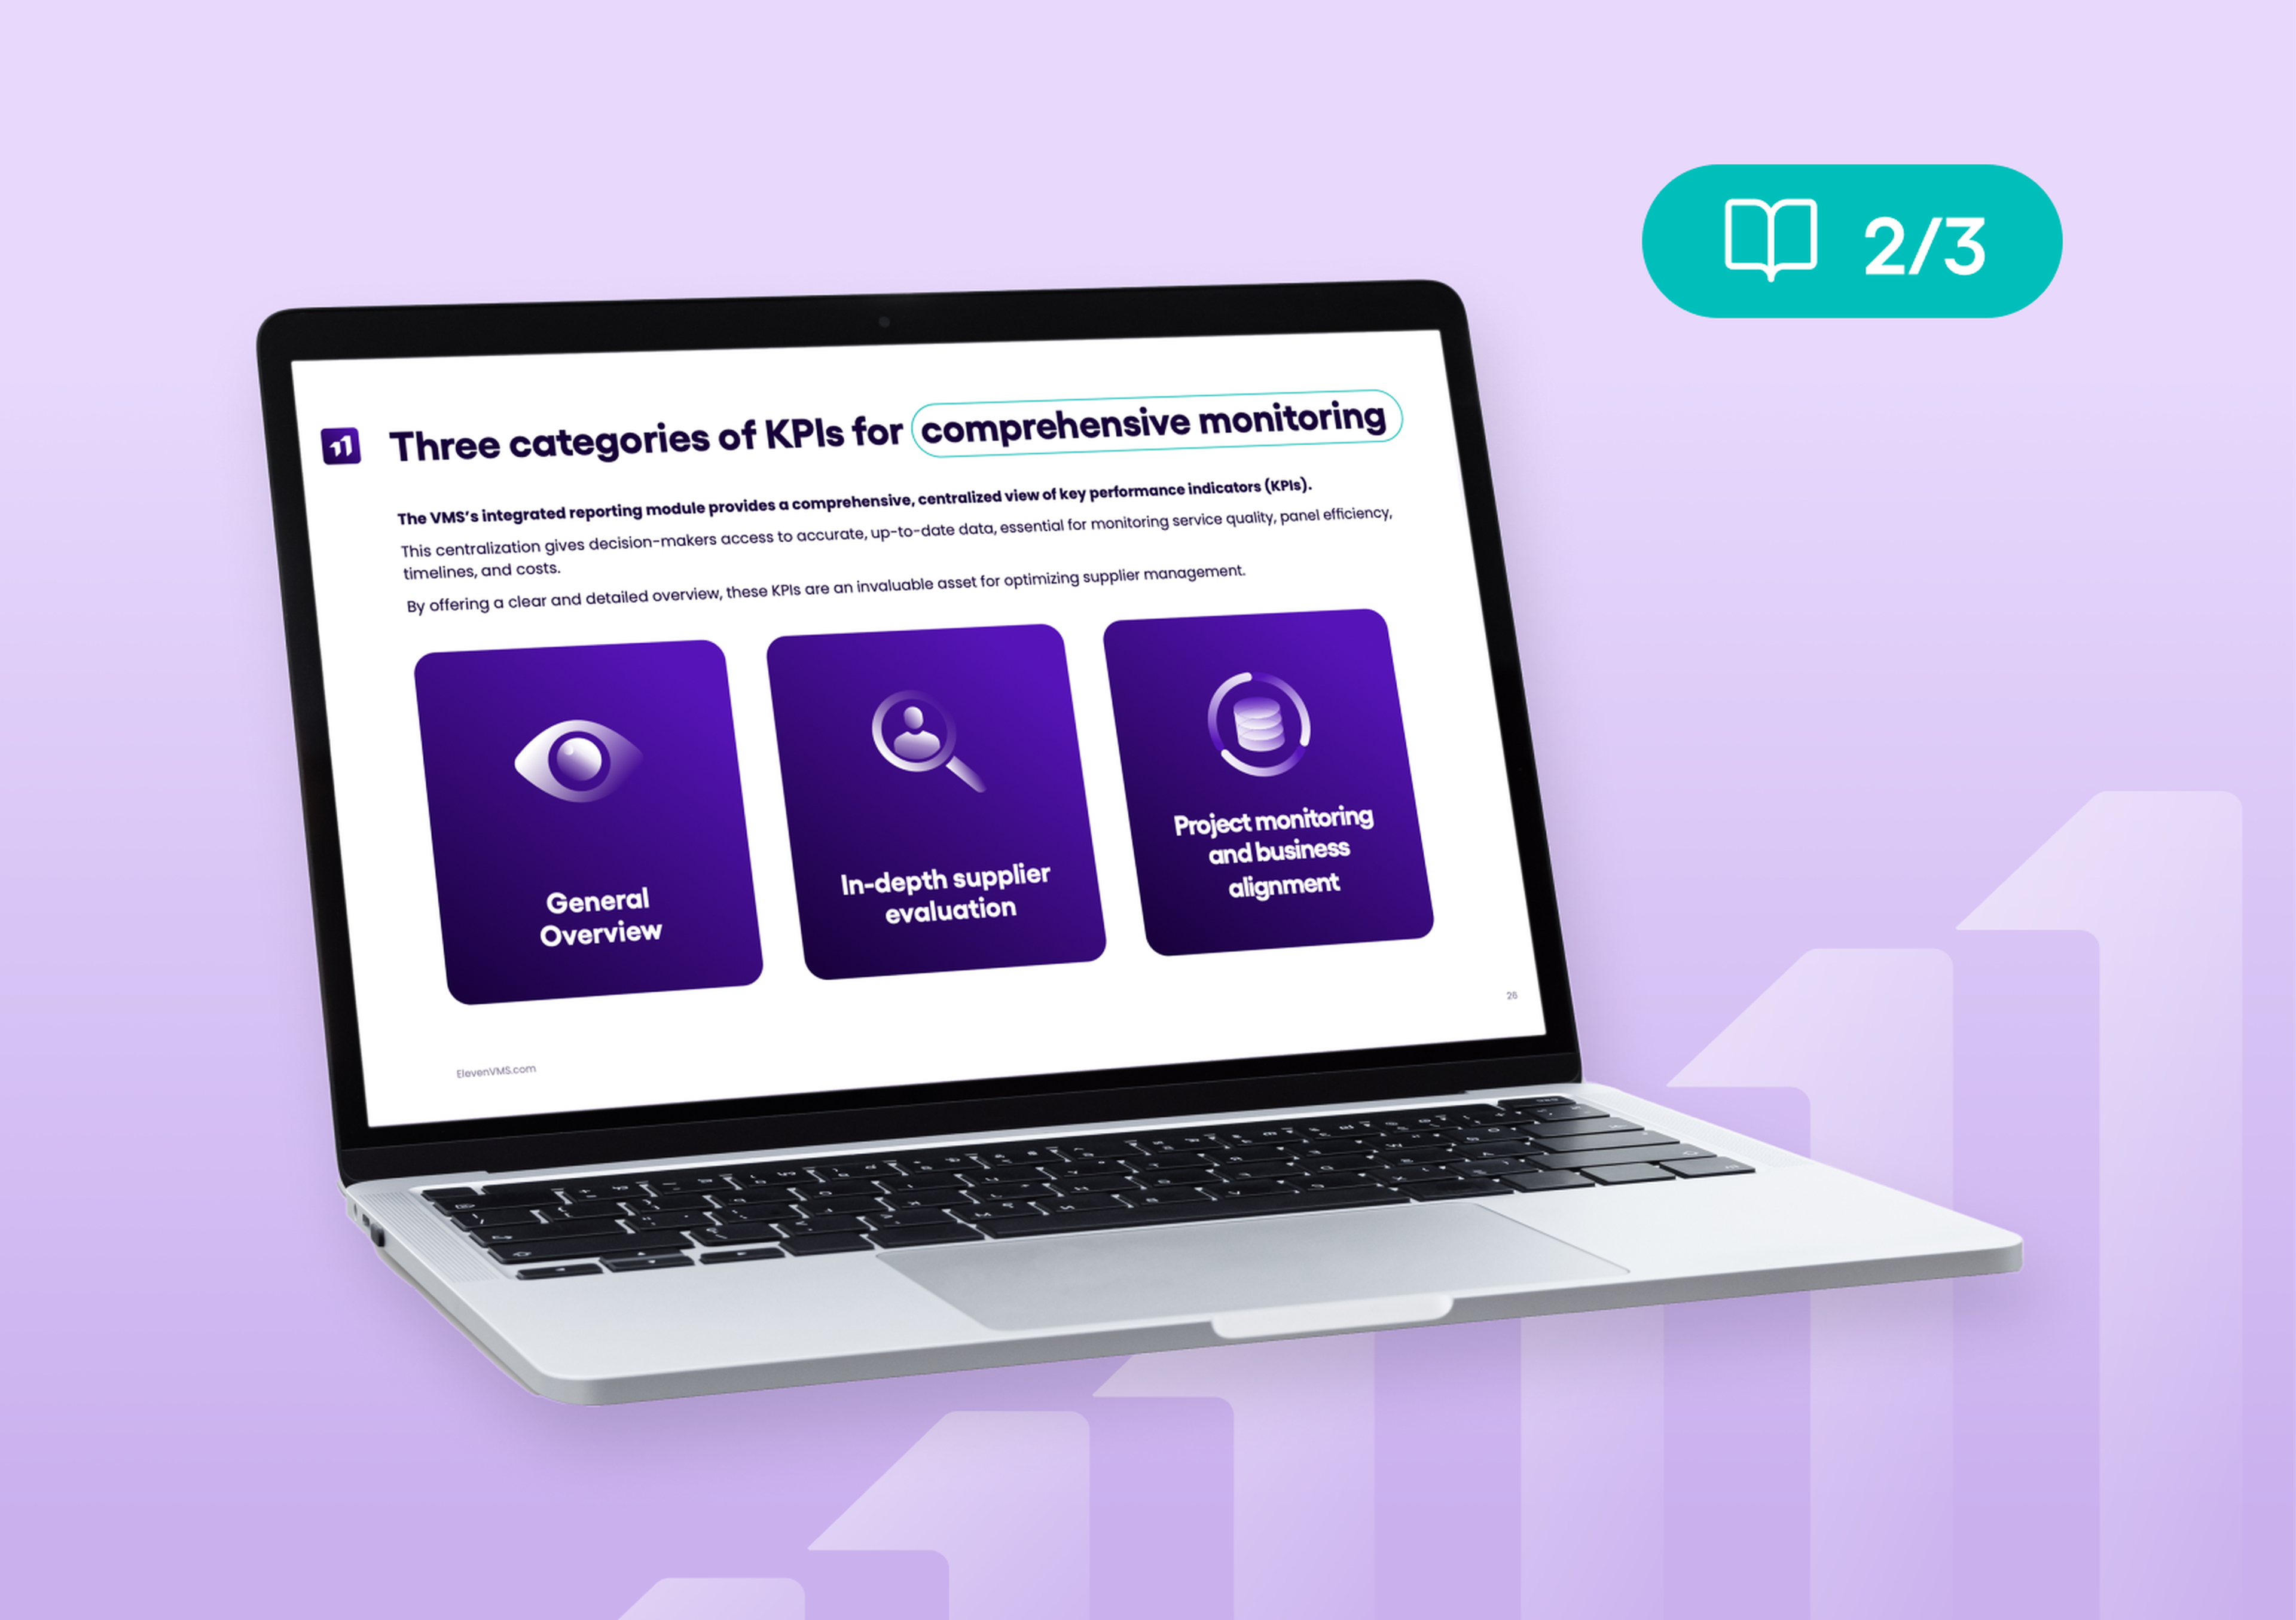
After extensive discussions with our clients, we have identified two main categories of KPIs: procurement performance and suppliers performance.
Measuring procurement performance
While financial aspects and cost tracking are often the most anticipated KPIs, it is also useful to analyze operational indicators. Here are some examples for each category:
Engaged spend: Track the evolution of your spending over a defined period.
Time to fill: Measure the efficiency of your sourcing process by calculating the average time between the publication of the request for proposal (RFP) and the creation of the purchase order.
Competitive savings: Monitor the percentage of savings achieved by comparing the average proposal prices to the final purchase order amounts.
Daily rate by role and location: Obtain the “right rate” rather than just the lowest one. Rate grids, based on skills and experience levels, help attract the right partners with competitive pricing. Consider location, as prices vary between Île-de-France, regions, nearshore (like Portugal and Spain), and offshore (like India).
Skills needs distribution: Track the most sought-after expertise categories to adjust your panel composition with the most suitable suppliers.
Measuring suppliers performance
Beyond overall procurement performance, evaluating the performance of your service suppliers is also key to keeping your panel as relevant as possible. Here are some quality-related indicators to track:
Response rate: Analyze your panel’s engagement with your needs.
Proposal conversion rate: Measure the success rate of each supplier by tracking the number of RFPs won.
Reasons for non-selection: Identify the main reasons for proposal rejections to optimize your panel.
Increasingly, companies are also incorporating sustainability criteria into their professional services procurement, such as carbon footprint and commitment to inclusion and diversity. In this case, it is relevant to consider the percentage of suppliers with specific certifications, which you can track on the LittleBig Connection platform via disability status and eco-certified status.
It is also possible to establish a supplier evaluation (scoring) through a single score, calculated from various criteria like those mentioned above, weighted and combined.
The LittleBig Connection KPIs module bridges the gap with reporting
Our VMS, LittleBig Rise, offers a comprehensive and intuitive reporting solution to optimize the management of your professional services procurement.
Our platform provides three main and complementary tools:
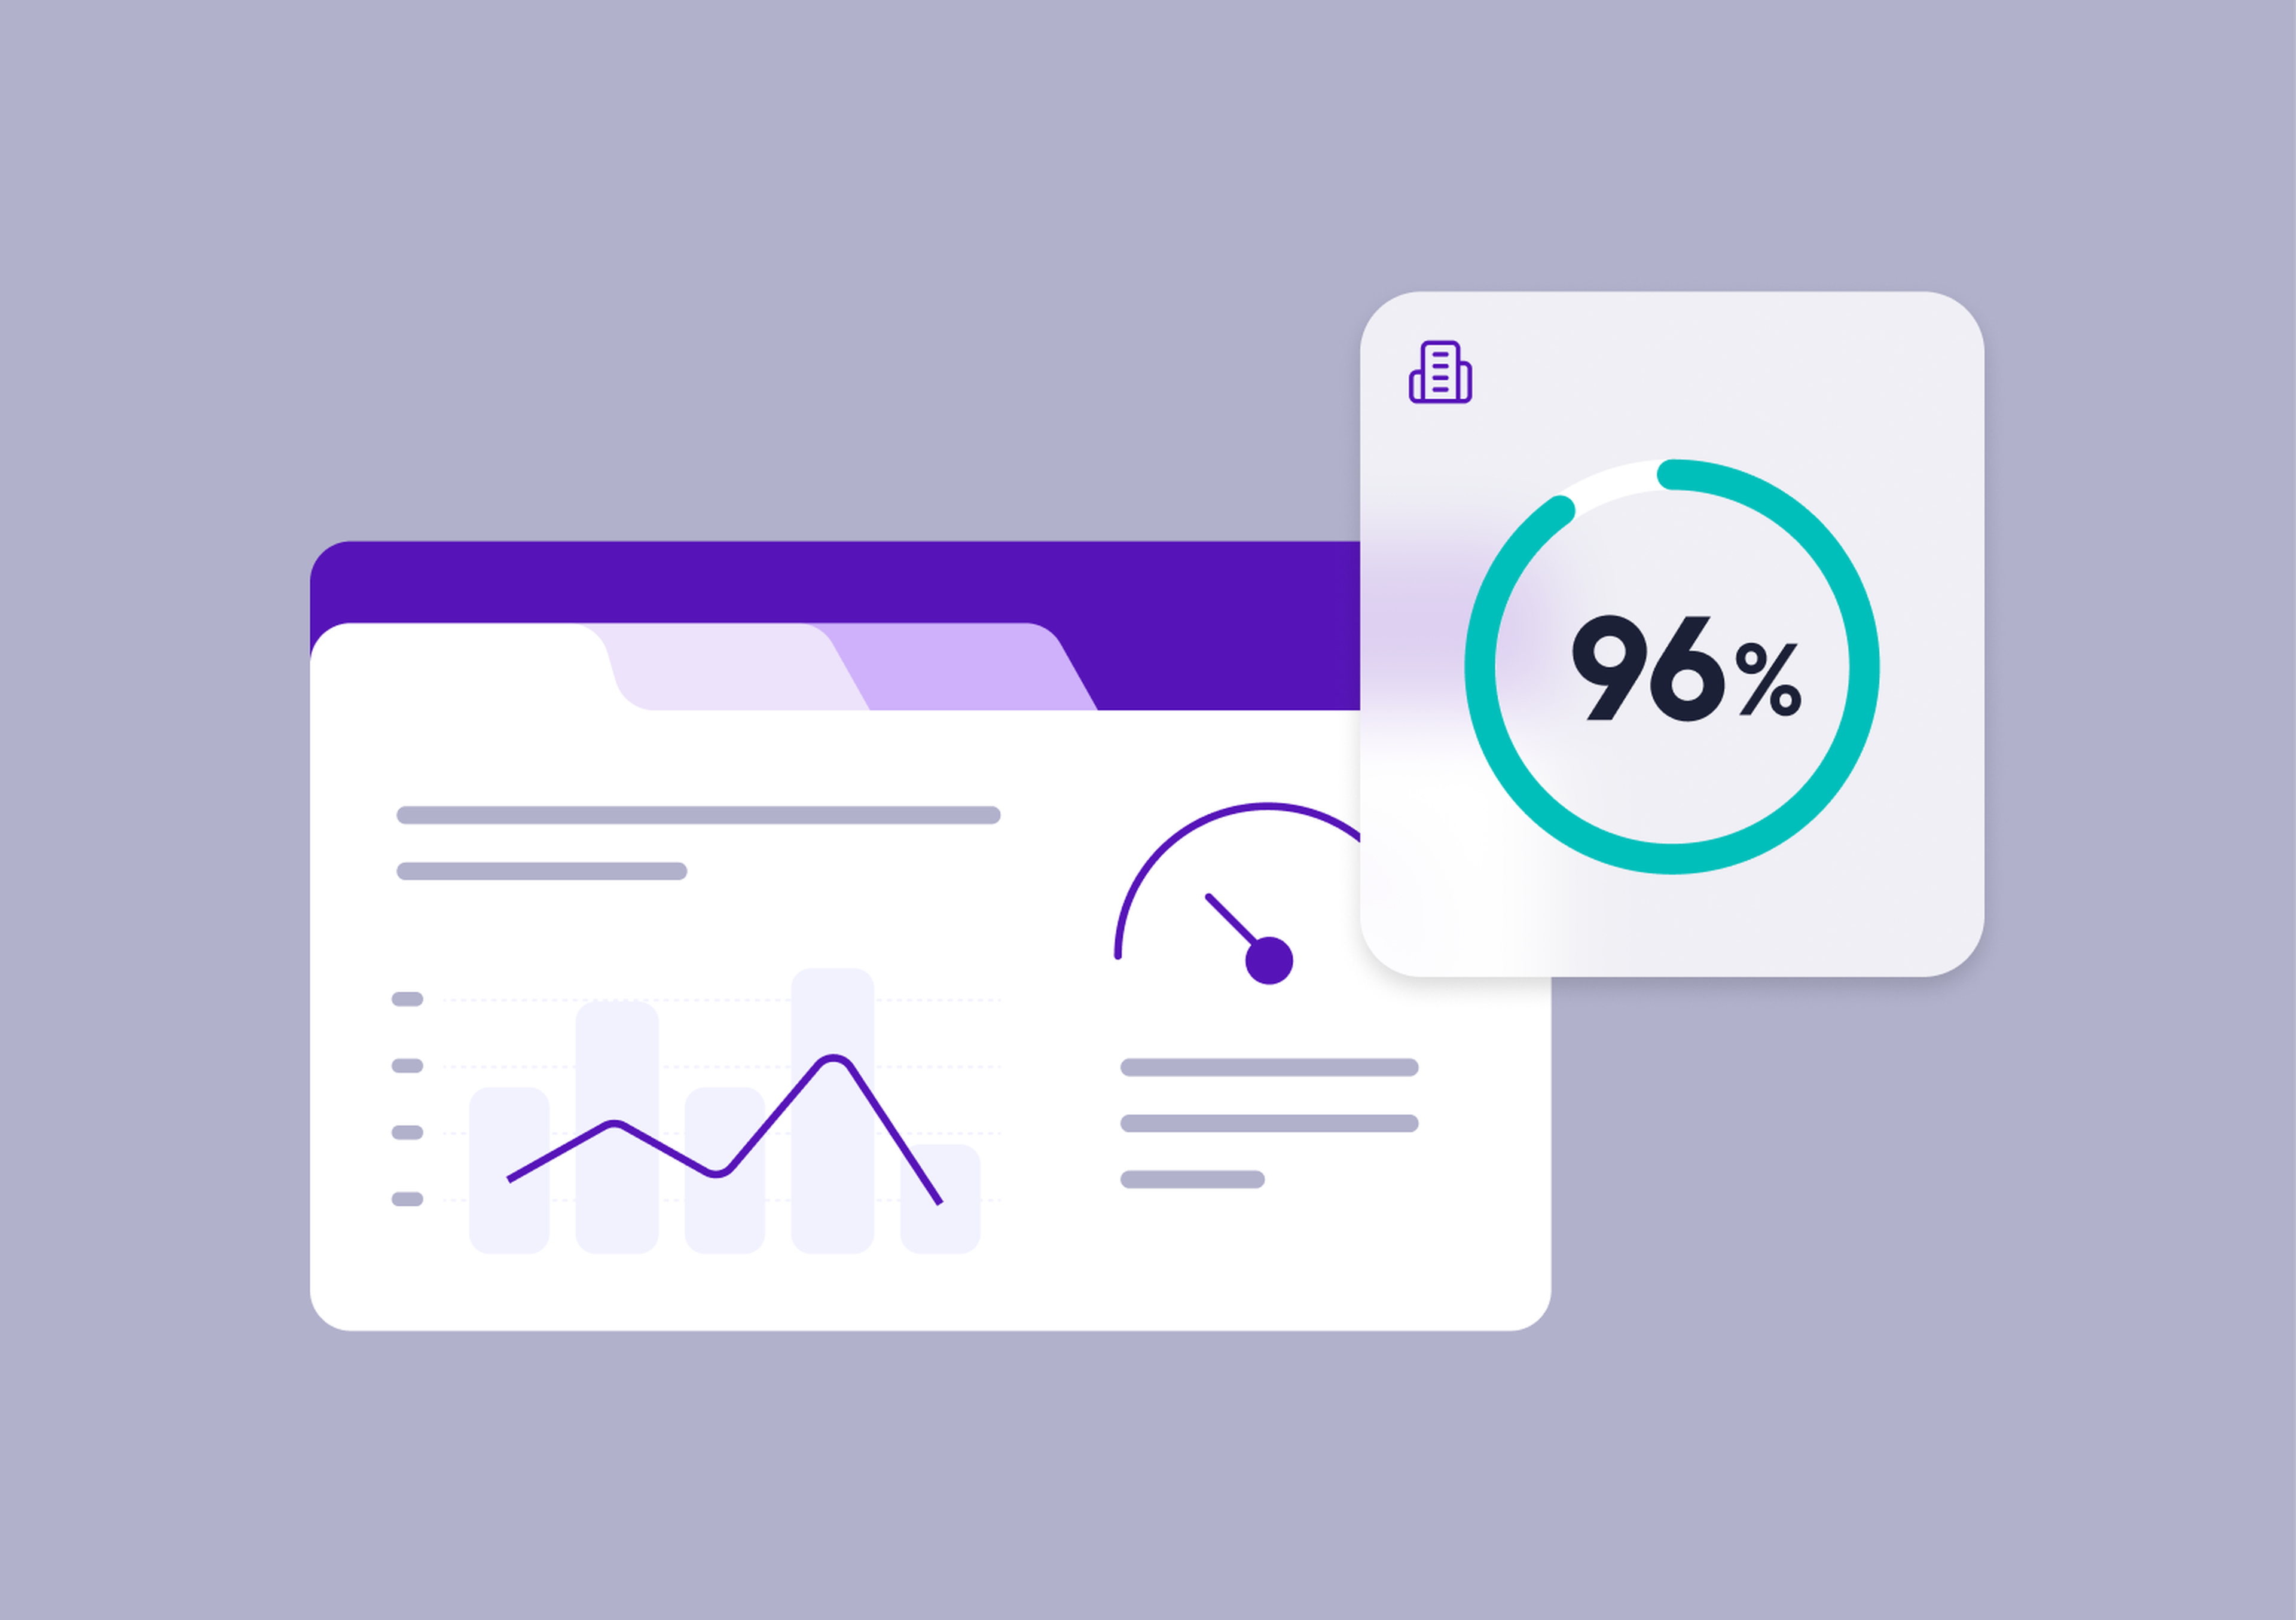
Reporting module: This tool allows you to track the performance of your procurement processes and suppliers through clear and instant visualization of essential data. It supports decision-making by enabling you to monitor each entity individually or in aggregate, while also offering comparison elements with previous periods to easily evaluate metric changes. Visual graphs, including funnels, help share data internally in an effective and understandable way.
Data export: For more customized analyses, our Excel export feature provides a large volume of raw data. This allows you to combine it with your own information and apply your specific calculation methods. Additionally, you benefit from personalized support from a dedicated Customer Success Manager.
API: Facilitates the integration of this data into your internal tools.
Contact us to discover how to optimize your procurement strategy with reliable and straightforward reporting solutions.